Generate a graph showing the contents of a vector.
Usage
paint_vector(
  data,
  layout = c("vertical", "horizontal"),
  show_indices = c("none", "inside", "outside"),
  highlight_area = NULL,
  highlight_color = "lemonchiffon",
  graph_title = paste0("Data Object: ", deparse(substitute(data))),
  graph_subtitle = NULL,
  sigfig = 3L,
  subtle_digits = c("insignificant", "rounded", "none"),
  max_chars = 12L,
  max_rows = 20L,
  max_cols = 15L,
  show_all = FALSE,
  fontsize = NULL,
  family = "mono",
  palette = NULL,
  show_names = TRUE,
  max_name_chars = 8L,
  highlight_locations = NULL
)

gpaint_vector(
  data,
  layout = c("vertical", "horizontal"),
  show_indices = c("none", "inside", "outside"),
  highlight_area = NULL,
  highlight_color = "lemonchiffon",
  graph_title = paste0("Data Object: ", deparse(substitute(data))),
  graph_subtitle = NULL,
  sigfig = 3L,
  subtle_digits = c("insignificant", "rounded", "none"),
  max_chars = 12L,
  max_rows = 20L,
  max_cols = 15L,
  show_all = FALSE,
  fontsize = NULL,
  family = "mono",
  palette = NULL,
  show_names = TRUE,
  max_name_chars = 8L,
  highlight_locations = NULL
)
Arguments
- data
An object that has the class of
vector. Factors, Dates and other classed atomic vectors are accepted too.- layout
Orientation of the vector. Default:
"vertical".- show_indices
Display data indices either
"inside"the cell,"outside"it, or"none". Default:"none". Exactly one value: a vector has a single index[i], so its placements are mutually exclusive. (A matrix or data frame has independent row, column and cell lanes, andpaint_matrix()does take several at once.)- highlight_area
Logical vector the same length as
data, marking the cells to fill. A length-one logical is recycled. Default:NULL, which highlights nothing.- highlight_color
Color to use to fill the background of a cell.
- graph_title
Title to appear in the upper left hand corner of the graph.
- graph_subtitle
Subtitle to appear immediately under the graph title.
NULL(the default) describes the data: its length and its class.NAor""draws no subtitle; any other string is drawn as given. The default reports the length of the data itself, not of the drawing, so an elided vector still reports all of its elements.- sigfig
Significant digits drawn in black. Digits past the
sigfig-th are drawn in grey; nothing is discarded. Must be in1:15.- subtle_digits
Which digits are drawn grey.
"insignificant"(the default) greys everything past thesigfig-th significant digit;"rounded"greys only digits the rendering actually lost;"none"draws everything black.- max_chars
Strings longer than this are truncated with an ellipsis.
- max_rows, max_cols
Elide the middle of the vector when it is longer than this. A vertical vector is elided by
max_rows, a horizontal one bymax_cols.- show_all
Draw every cell, however small the text becomes. Warns when the text falls below the legibility floor.
- fontsize
Font size in points.
NULL(the default) fits the text to the device.- family
Font family.
"mono"by default.- palette
Colour palette for the drawing. One of
"mint"(the default),"slate","warm", or"classic"(the original look). Defaults to the"paintr.palette"option when unset. A named list of colours is also accepted.- show_names
Draw the vector's
names()in the label lane its layout gives it: a gutter to the left when the vector is vertical, a lane above it when it is horizontal. Default:TRUE. A logical scalar, becausenames()returns one vector. An unnamed vector draws no lane.show_indices = "outside"wins that lane, because the caller asked for it by name.show_indices = "inside"draws the index within the cell, so it composes with the names instead of competing with them.- max_name_chars
Longest a name may be drawn before it is truncated. Default:
8. It bites only a"horizontal"vector, whose names sit over the cells and widen them; a vertical vector's names are in a gutter of their own and are truncated atmax_charsinstead.- highlight_locations
Shorthand for
highlight_area: instead of building a mask, give the element positions to fill and the mask is built for you withhighlight_locations(). Sohighlight_locations = c(2, 4)is exactlyhighlight_area = highlight_locations(data, c(2, 4)). A vector has a single axis addressed by position, so this is the only shorthand it takes – there are no rows or columns to name. Supplyinghighlight_areatogether with it is an error. Default:NULL.
Value
paint_vector() invisibly returns the resolved cell table. See paint_matrix()
for its components.
gpaint_vector() returns a ggplot object.
Details
paint_vector() draws on the current base graphics device.
gpaint_vector() returns a ggplot object.
The ggplot object is a shell
gpaint_vector() returns a real ggplot object – + theme(), ggsave(),
print() and knitr chunks all work – but its panel is drawn entirely by a
custom grid grob, held in a single annotation_custom() over a meaningless
0..1 coordinate system. There is no aes(), no geom and no scale carrying
any meaning, so:
ggplot_build()sees an empty layer.+ scale_fill_*(),+ scale_x_*()and friends have no effect on the drawing. Usehighlight_areaandhighlight_colorto fill cells.+ geom_point()would draw onto the0..1coordinate system, not onto the cells.
This is not a shortcut around ggplot2. The cell text is fitted to the device at
draw time, which no geom can do, because a layer is built long before the
device size is known; and every number is drawn as two spans in two colors,
which geom_text() cannot do at all. A custom grob is the only mechanism that
can do either.
See also
Other painters:
paint_array(),
paint_data_frame(),
paint_list(),
paint_matrix(),
paint_size()
Examples
# Base graphics
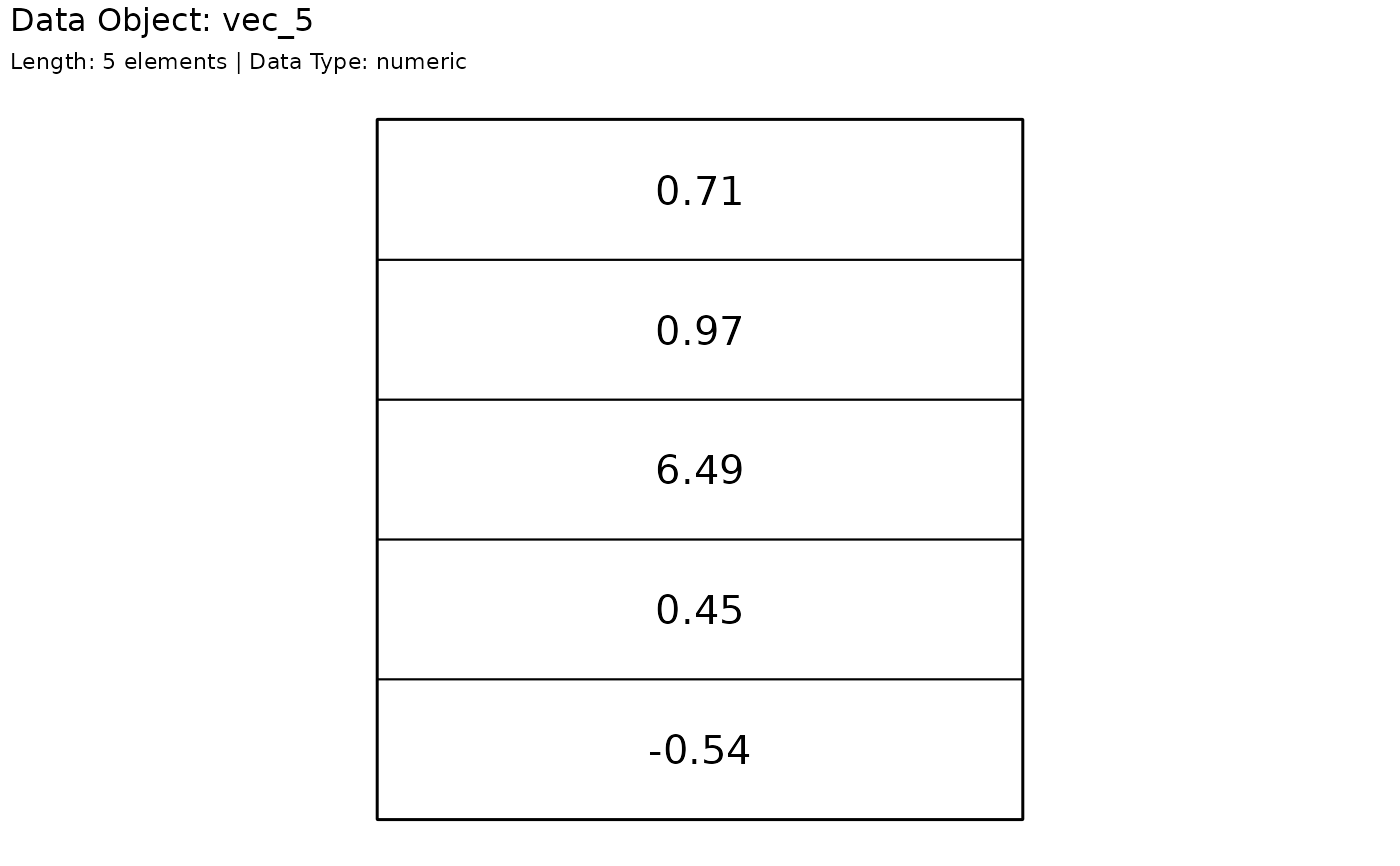
# Visualize a vector with 5 elements
vec_5 <- round(rnorm(5, 0, 4), 2)
paint_vector(vec_5)
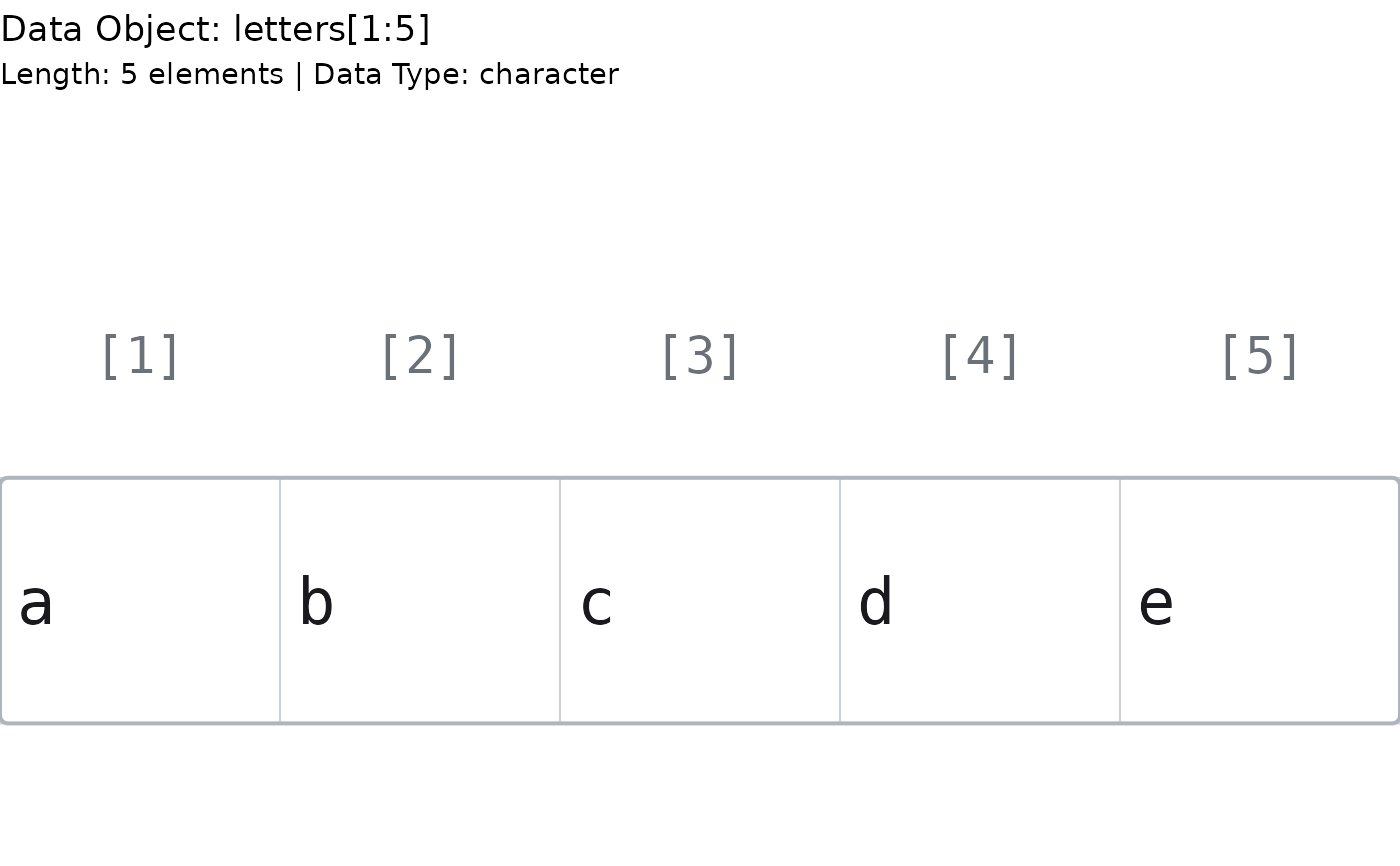
 # Character vectors render as the strings they contain.
paint_vector(letters[1:5], layout = "horizontal")
# Character vectors render as the strings they contain.
paint_vector(letters[1:5], layout = "horizontal")
 # A named vector draws its names, like print() does.
paint_vector(c(alpha = 1, beta = 2.5, gamma = -30))
# A named vector draws its names, like print() does.
paint_vector(c(alpha = 1, beta = 2.5, gamma = -30))
 # The name beside the cell, the accessor inside it: both at once.
paint_vector(c(alpha = 1, beta = 2.5), show_indices = "inside")
# The name beside the cell, the accessor inside it: both at once.
paint_vector(c(alpha = 1, beta = 2.5), show_indices = "inside")
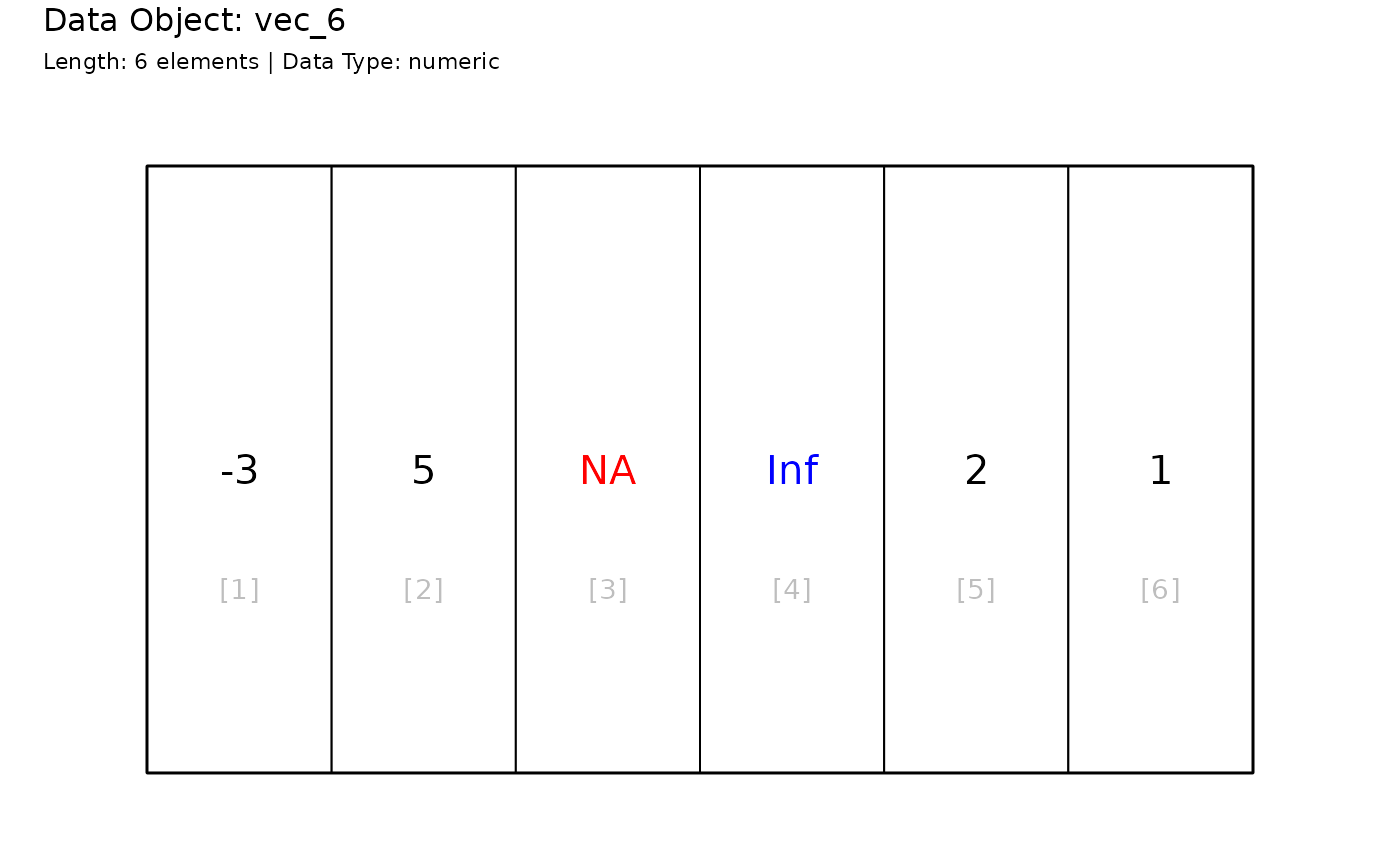
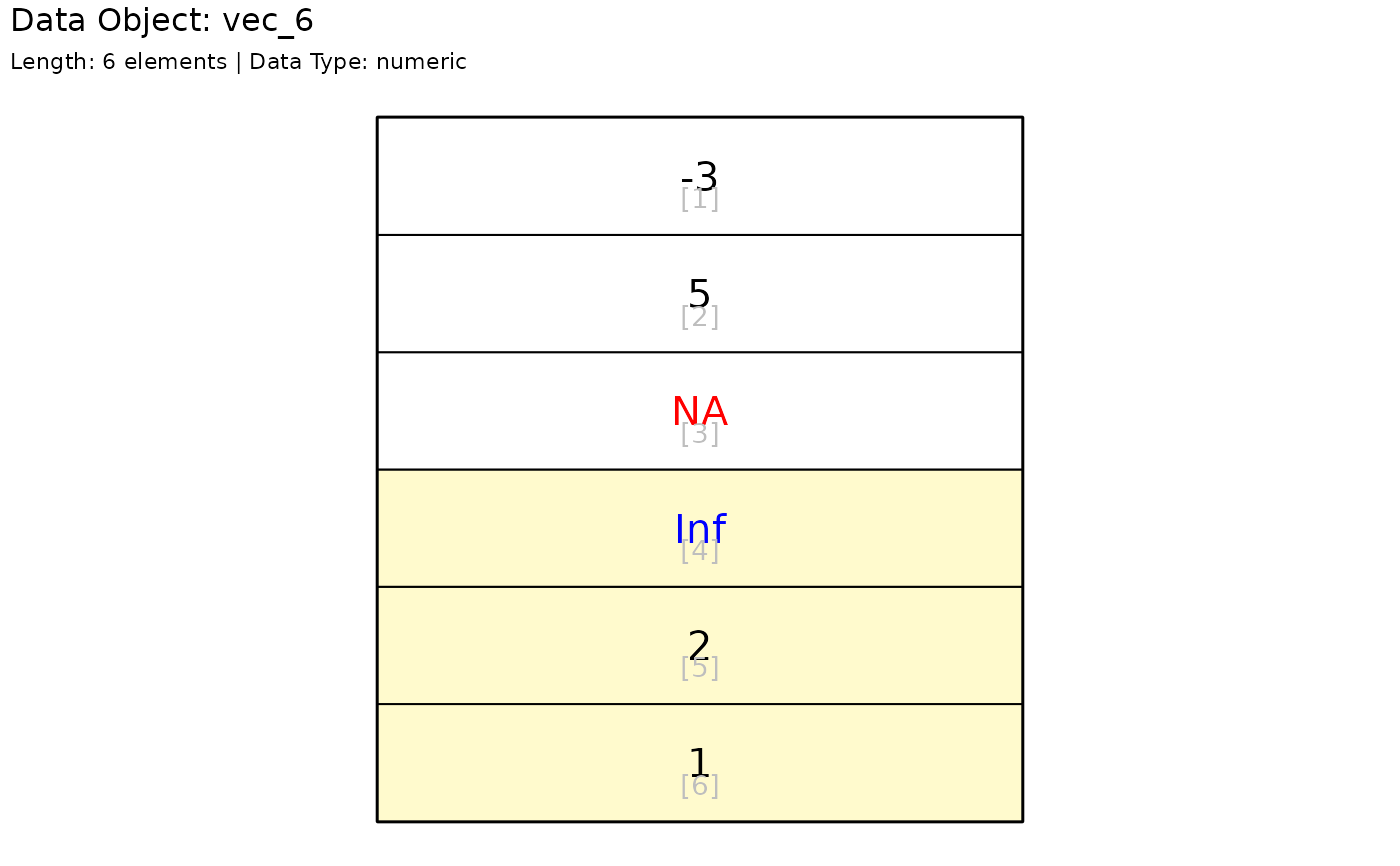 # Visualize a 6 element vector with indices underneath the data
vec_6 <- c(-3, 5, NA, Inf, 2, 1)
paint_vector(vec_6, layout = "horizontal", show_indices = "inside")
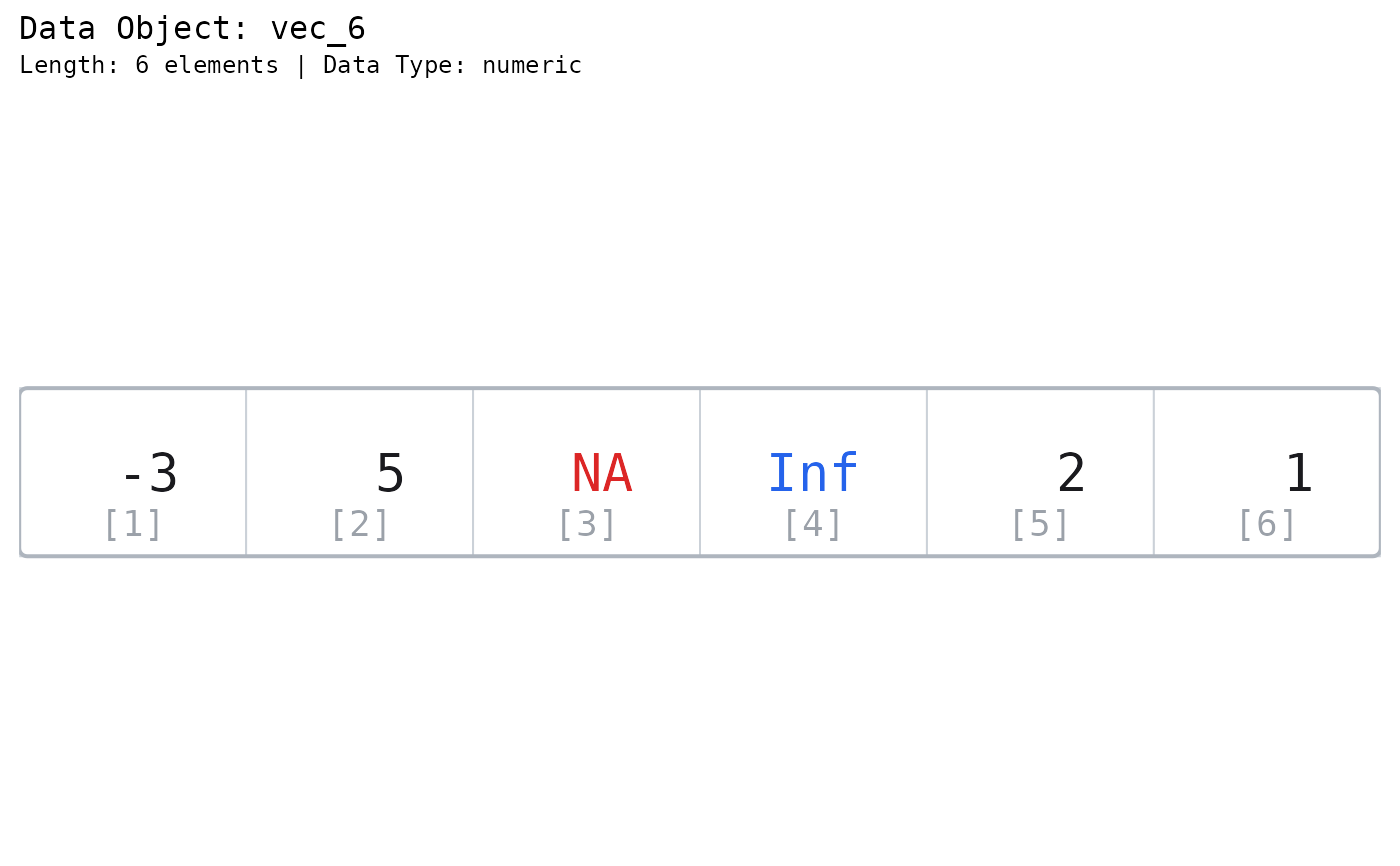
# Visualize a 6 element vector with indices underneath the data
vec_6 <- c(-3, 5, NA, Inf, 2, 1)
paint_vector(vec_6, layout = "horizontal", show_indices = "inside")
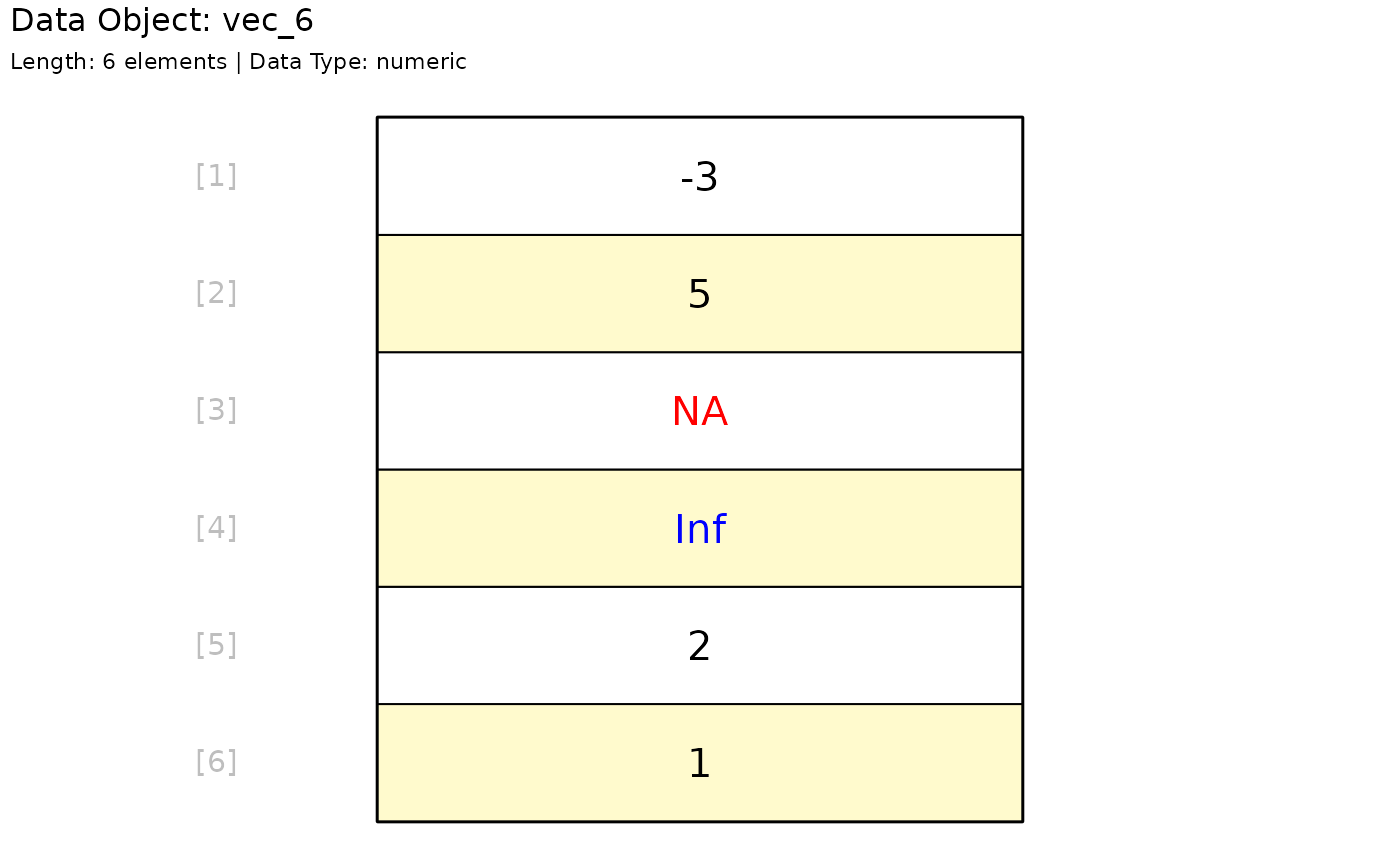
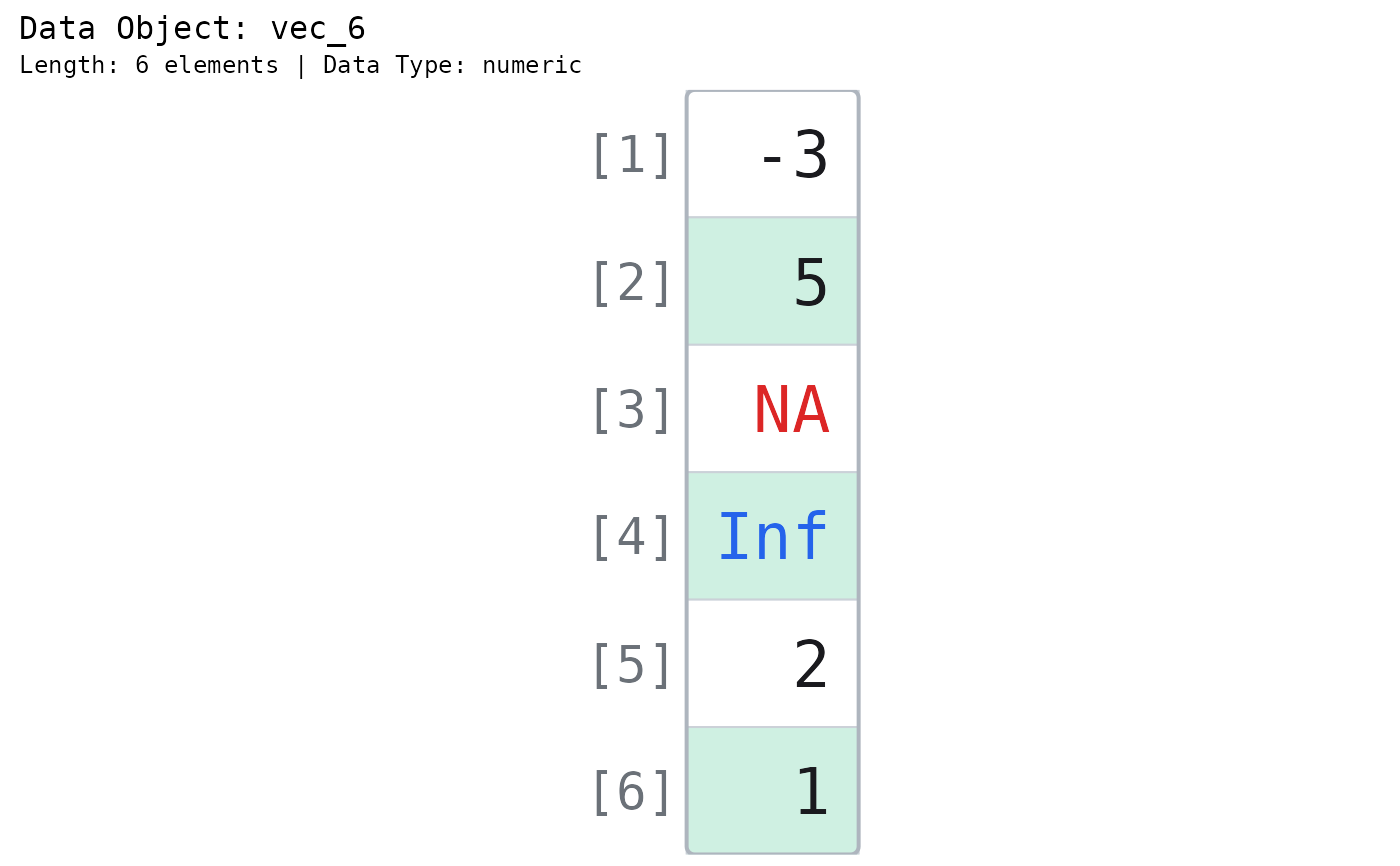
 # Highlight the 2nd, 4th, and 6th cell with indices shown outside
paint_vector(
vec_6, show_indices = "outside",
highlight_area = highlight_locations(vec_6, c(2, 4, 6))
)
# Highlight the 2nd, 4th, and 6th cell with indices shown outside
paint_vector(
vec_6, show_indices = "outside",
highlight_area = highlight_locations(vec_6, c(2, 4, 6))
)
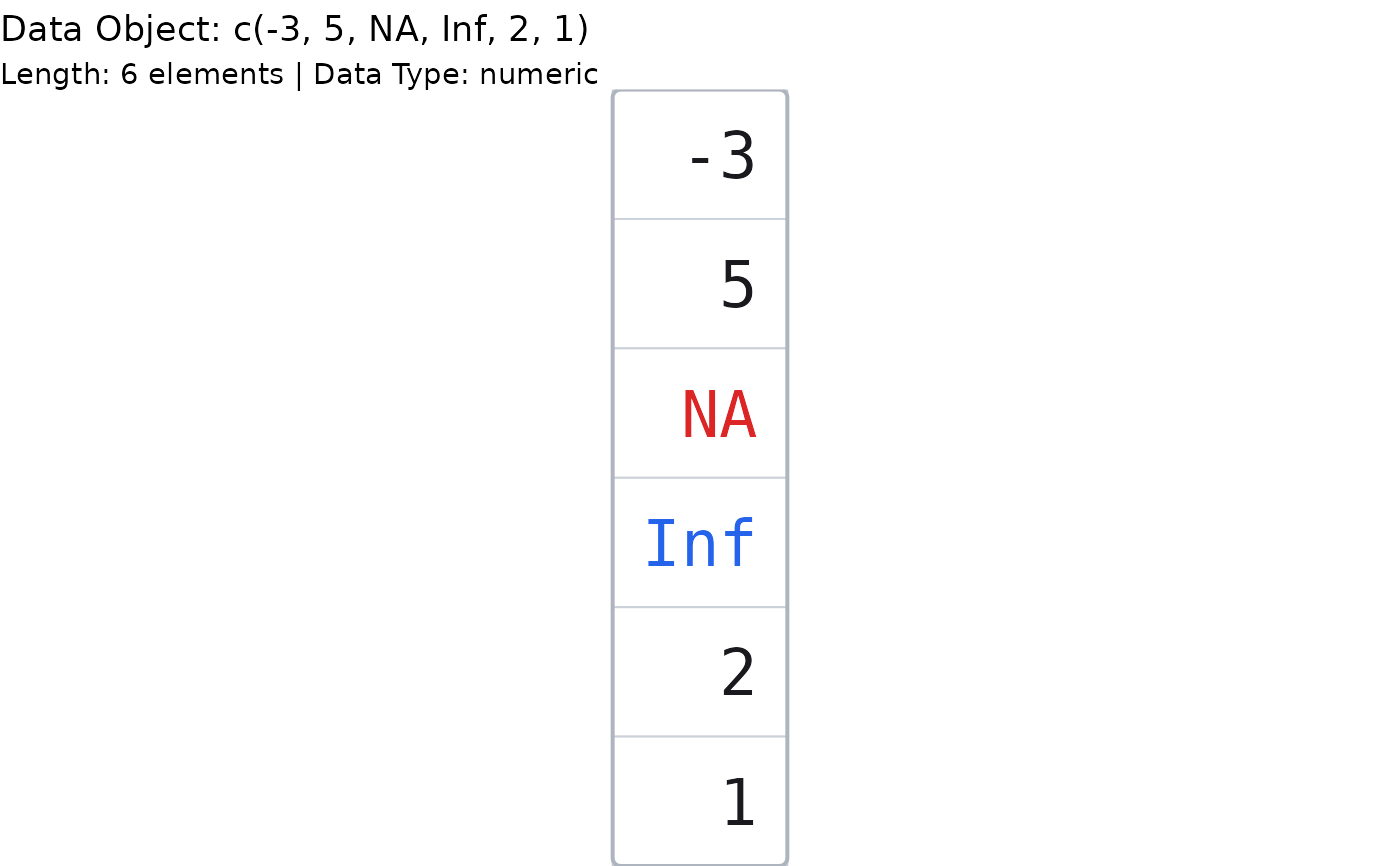
 # ggplot2 graphics ----
gpaint_vector(c(-3, 5, NA, Inf, 2, 1))
# ggplot2 graphics ----
gpaint_vector(c(-3, 5, NA, Inf, 2, 1))
 gpaint_vector(letters[1:5], layout = "horizontal", show_indices = "outside")