emeans works with tidymodels through two optional packages, tidyclust and generics, and the code below runs only when both are installed.
broom-style methods
The broom-style verbs tidy(), glance() and augment() return plain data frames, so no tibble is required to enjoy them.
#>            a          b size  withinss cluster
#> 1 2.97908660 2.95016881  200 116.17543       1
#> 2 0.01776982 0.02031885  200  93.76613       2
#>      totss tot.withinss betweenss      obj iter epochs n_splits
#> 1 1945.283     209.9416  1735.342 211.4012  500      5        0
#>             a          b .cluster
#> 1 -0.31322691  0.2047009        2
#> 2  0.09182166  0.8444366        2
#> 3 -0.41781431  0.7932942        2
#> 4  0.79764040 -0.1654539        2
#> 5  0.16475389 -1.1426178        2
#> 6 -0.41023419  1.2488308        2
augment() reuses the training labels when data is the training set, while passing newdata labels fresh observations through predict() instead.
The tidyclust engine
Loading tidyclust registers an "emeans" engine for k_means(), so the usual specification needs nothing more than a different set_engine():
#> tidyclust cluster object
#>
#> e-means clustering: k = 2, 400 rows
#>   epochs 3, batch 2, alpha0 0.0672
#>   tot.withinss 209.942 (between_SS / total_SS = 89.2 %), n_splits 0
#>   device cpu
Engine arguments such as nepochs, spherical and threads pass straight through to emeans(), and the usual tidyclust helpers work on the result:
#> # A tibble: 2 × 3
#>   .cluster       a      b
#>   <fct>      <dbl>  <dbl>
#> 1 Cluster_1 2.98   2.95
#> 2 Cluster_2 0.0178 0.0203
#> # A tibble: 3 × 1
#>   .cluster
#>   <fct>
#> 1 Cluster_2
#> 2 Cluster_2
#> 3 Cluster_2
#> # A tibble: 5 × 1
#>   .pred_cluster
#>   <fct>
#> 1 Cluster_2
#> 2 Cluster_2
#> 3 Cluster_2
#> 4 Cluster_2
#> 5 Cluster_2
#> # A tibble: 1 × 3
#>   .metric          .estimator .estimate
#>   <chr>            <chr>          <dbl>
#> 1 sse_within_total standard        210.
The within-cluster and total sums of squares that tidyclust expects come straight from the fit, since emeans() adds them up in the same sweep that labels the rows.
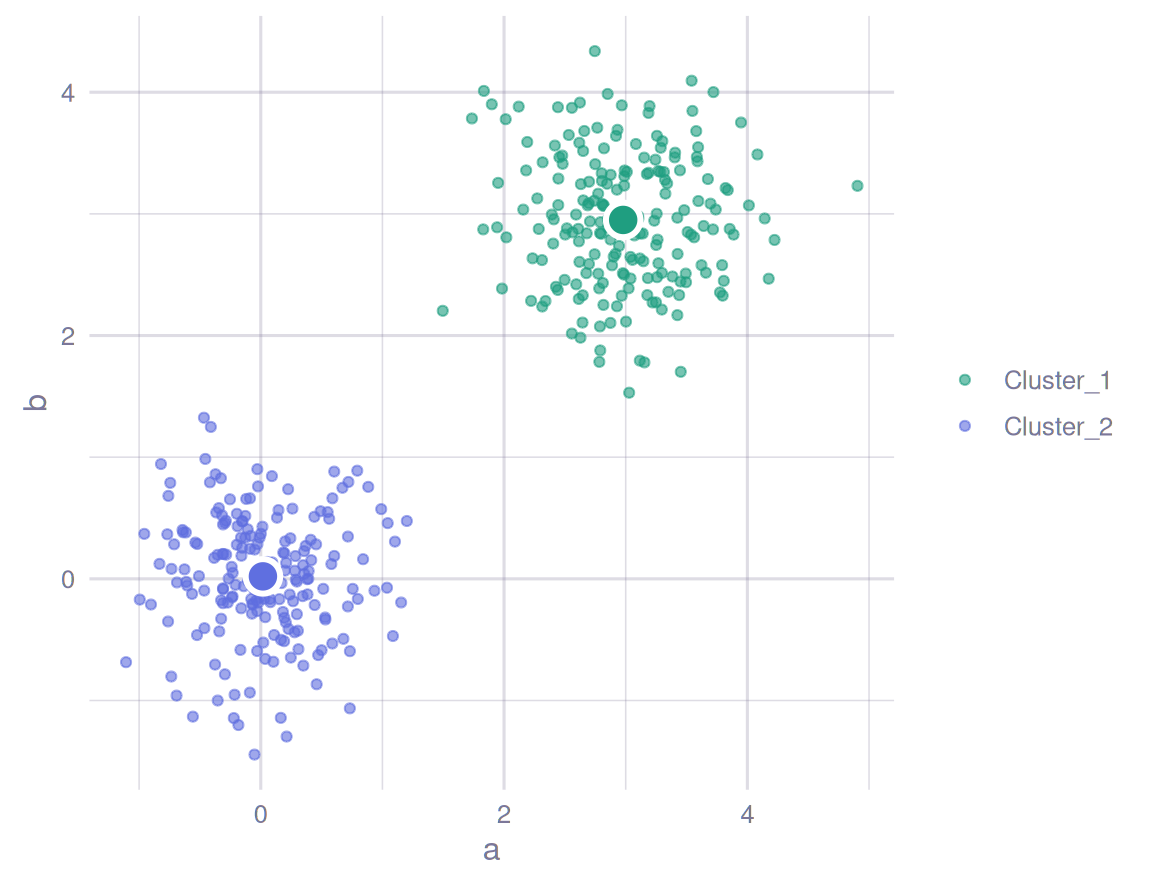
Plotting with ggplot2
The tidyclust helpers return data frames, which ggplot2 happily takes as they are; this chunk runs only when ggplot2 is installed as well.
library(ggplot2)

points <- cbind(df, extract_cluster_assignment(spec_fit))
centers <- extract_centroids(spec_fit)
ink <- "#7C7799"

ggplot(points, aes(a, b, colour = .cluster)) +
  geom_point(alpha = 0.6, size = 1.4) +
  geom_point(data = centers, aes(fill = .cluster), shape = 21, size = 5,
             colour = "white", stroke = 1.6, show.legend = FALSE) +
  scale_colour_manual(values = c("#1F9E80", "#5F6FE0"),
                      aesthetics = c("colour", "fill")) +
  coord_equal() +
  labs(colour = NULL) +
  theme_minimal(base_size = 12) +
  theme(plot.background = element_rect(fill = NA, colour = NA),
        text = element_text(colour = ink),
        axis.text = element_text(colour = ink),
        panel.grid = element_line(colour = adjustcolor(ink, alpha.f = 0.25)))