The experimental em_*() functions run e-means one batch at a time, which lets the data stay on disk while only the current batch visits memory. To keep things honest, this vignette streams every batch from a binary file of doubles written with writeBin().
The data file
Our file holds n rows of d doubles stored one row after another, and the last line confirms that its size is exactly what that implies.
em_begin() takes the total number of rows and the starting centers and returns a training state, whose $recipe holds the two numbers you need to feed it:
recipe$batch_size rows per batch;
recipe$epoch_rows[i] rows in pass i.
The rules come straight from upstream: every batch has exactly batch_size rows except the last of each pass, which takes the remainder, and each pass delivers exactly epoch_rows[i] rows, namely the first that many of a fresh shuffle of all rows. Each batch goes through em_accumulate() and then em_update(), and each pass ends with em_end_epoch(); if a batch is too big to read in one go, you may hand it to em_accumulate() in several pieces that all count towards the same batch.
#> e-means clustering: k = 3, 20000 rows in the last pass#> epochs 3, batch 64, alpha0 0.217#> last-pass objective 79871.3, n_splits 0#> device cpu
em_finalize() returns an ordinary "emeans" object whose cluster is NULL, because only you know where the rows live, so keeping the last-pass labels falls to you, as in the loop above. emeans() would finish with a sweep that relabels every row against the final centers and adds up the sums of squares, but the loop has no data left to sweep, so those labels were computed mid-pass and a few may not match the nearest final center, which predict() will supply on request.
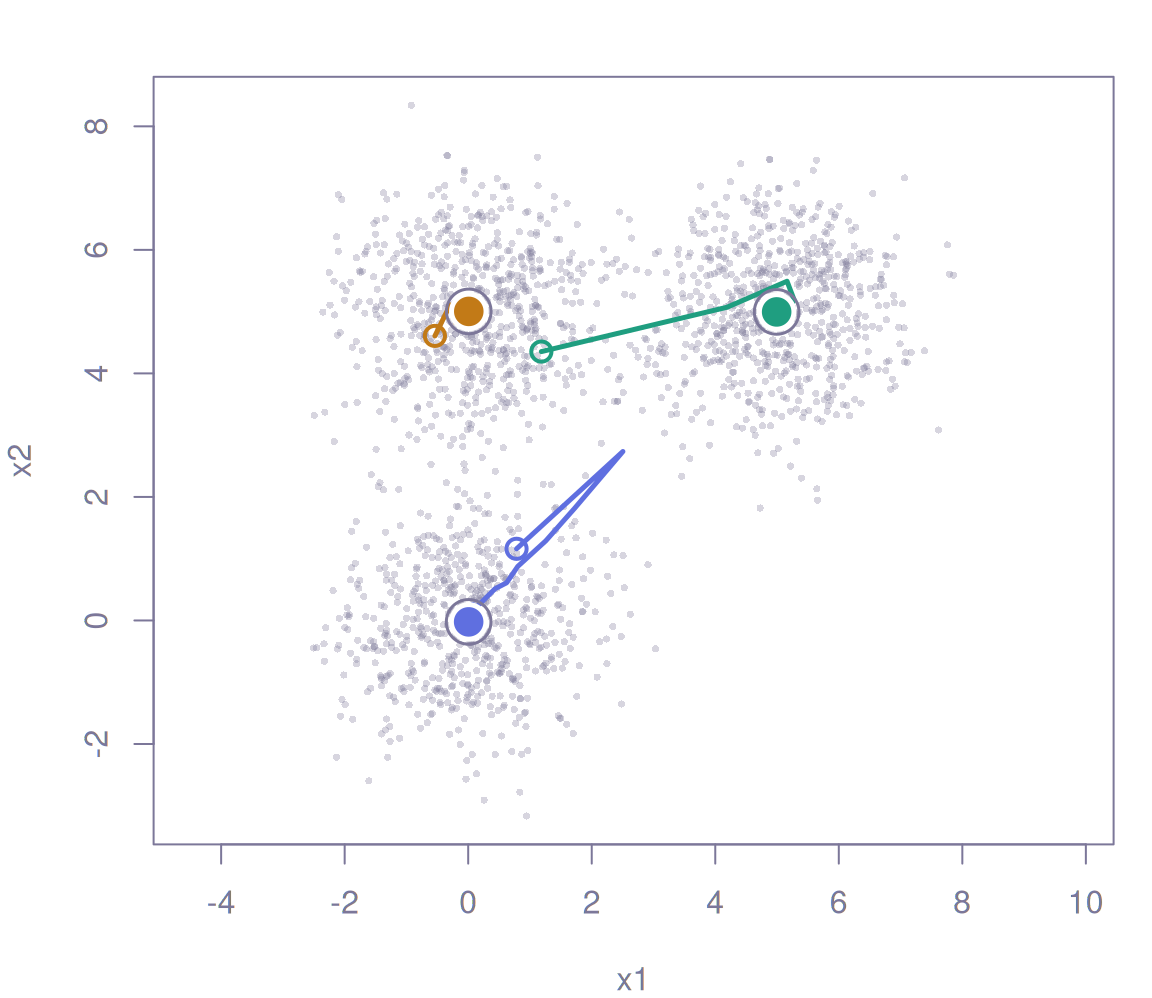
The loop also saved em_centers(st) after every update, and drawing those positions on the first two coordinates shows each centroid travelling from its random start into the middle of its cluster, striding at first and shuffling by the end as the step size shrinks. Hollow circles mark the random starts and filled ones the final centers.
paths<-simplify2array(trail)# k x d x number of updatescols<-c("#1F9E80", "#5F6FE0", "#C27A17")keep<-sample.int(n, 2000)plot(x[keep, 1:2], pch =16, cex =0.5, col =adjustcolor("#7C7799", alpha.f =0.3), xlab ="x1", ylab ="x2", asp =1)for(jinseq_len(nrow(fit$centers))){lines(paths[j, 1, ], paths[j, 2, ], col =cols[j], lwd =2.5)points(paths[j, 1, 1], paths[j, 2, 1], col =cols[j], cex =1.4, lwd =2)}points(fit$centers[, 1:2], pch =21, bg =cols, col ="white", cex =2.4, lwd =2.5)points(fit$centers[, 1:2], pch =1, cex =3.1, lwd =1.5)
Checking progress
em_centers(st) returns the current centers at any point, which is handy for keeping an eye on a long run. The functions reject any call that breaks the batch rules before touching the state, so a failed call costs nothing and can be retried with the right rows.
For data that fits in memory, emeans() runs this very loop for you and spares you the bookkeeping.