Handles how discrete distributions are graphed. Users should not use this
function. Instead, users should use link{visualize.it}.
Usage
visualize.discrete(dist, stat = c(0, 1), params, section = "lower", strict)Arguments
- dist
contains the distribution from
link{visualize.distributions}.- stat
a statistic to obtain the probability from. When using the "bounded" condition, you must supply the parameter as
stat = c(lower_bound, upper_bound). Otherwise, a simplestat = desired_pointwill suffice.- params
A list that must contain the necessary parameters for each distribution. For example,
params = list(n = 5, prob = .25)would be for a binomial distribution with size 5 and probability .75. If you are not aware of the parameters for the distribution, consider using thevisualize.dist_name functions listed under the "See Also" section.- section
Select how you want the statistic(s) evaluated via
section=either"lower","bounded","upper", or"tails".- strict
Determines whether the probability will be generated as a strict (<, >) or equal to (<=, >=) inequality.
strict=requires either values = 0 or =FALSE for equal to OR values =1 or =TRUE for strict. For bounded condition use:strict=c(0,1)orstrict=c(FALSE,TRUE).
Examples
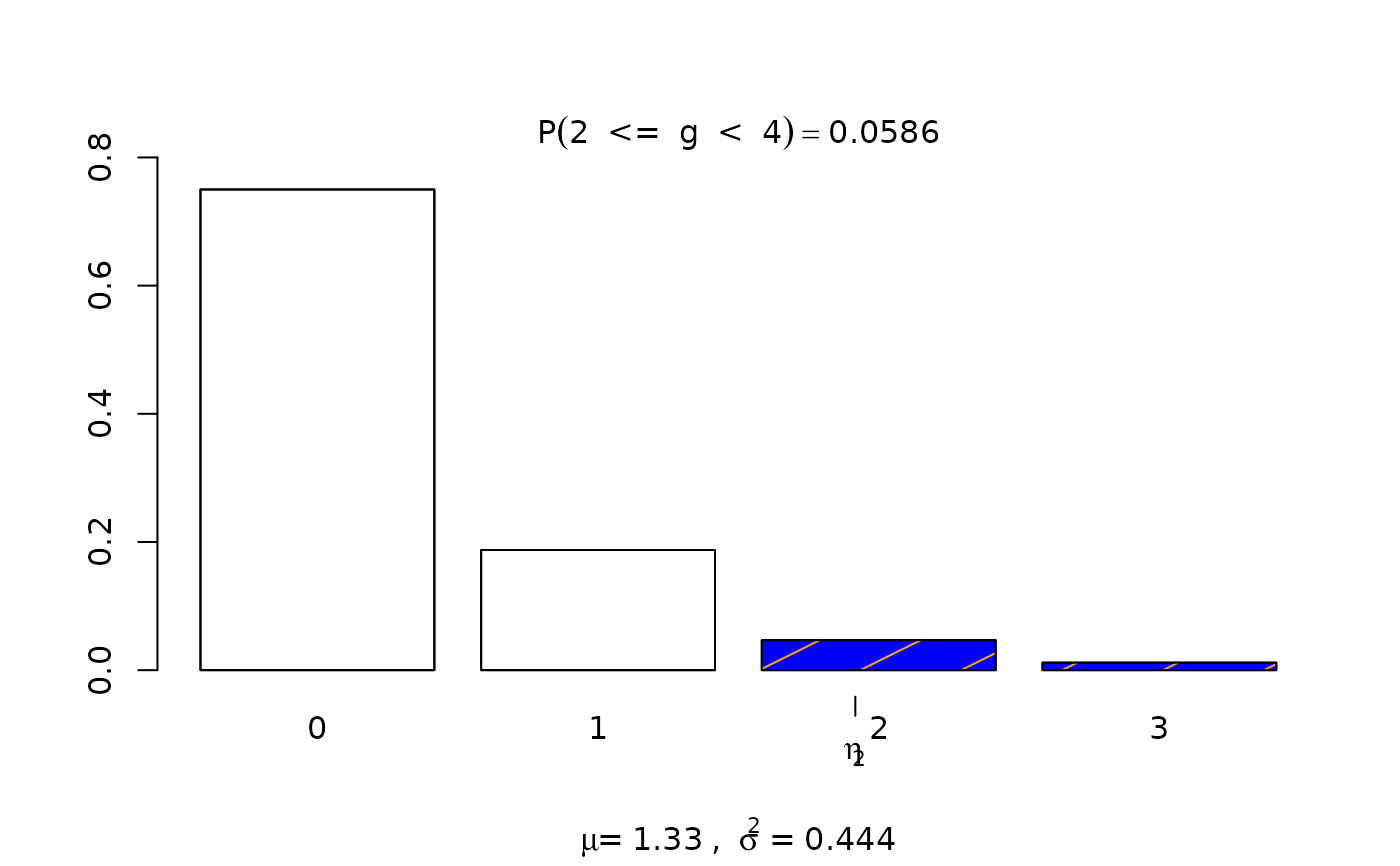
# Function does not have dist look up, must go through visualize.it
visualize.it(dist='geom', stat = c(2,4), params = list(prob = .75), section = "bounded",
          strict = c(0,1))