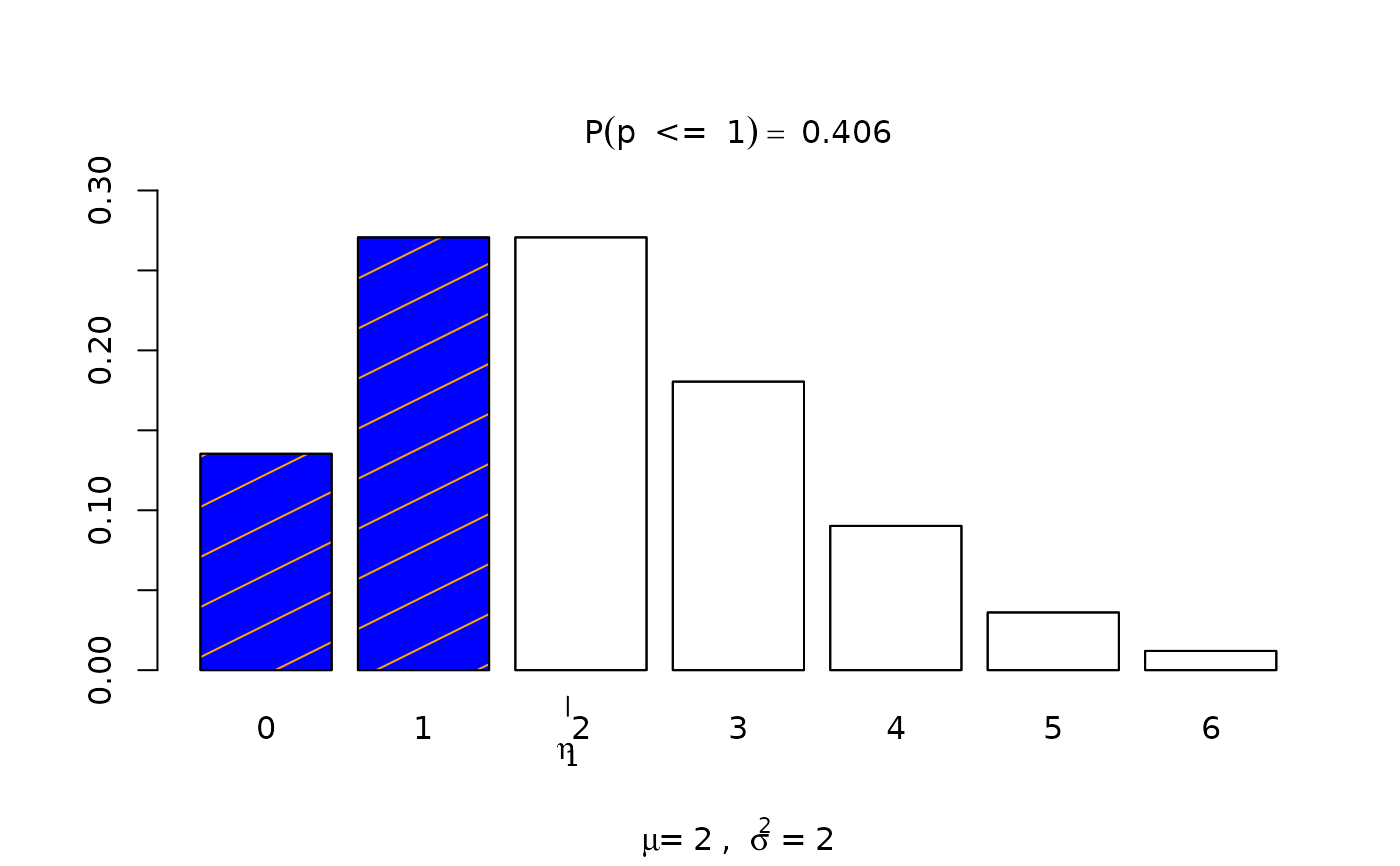
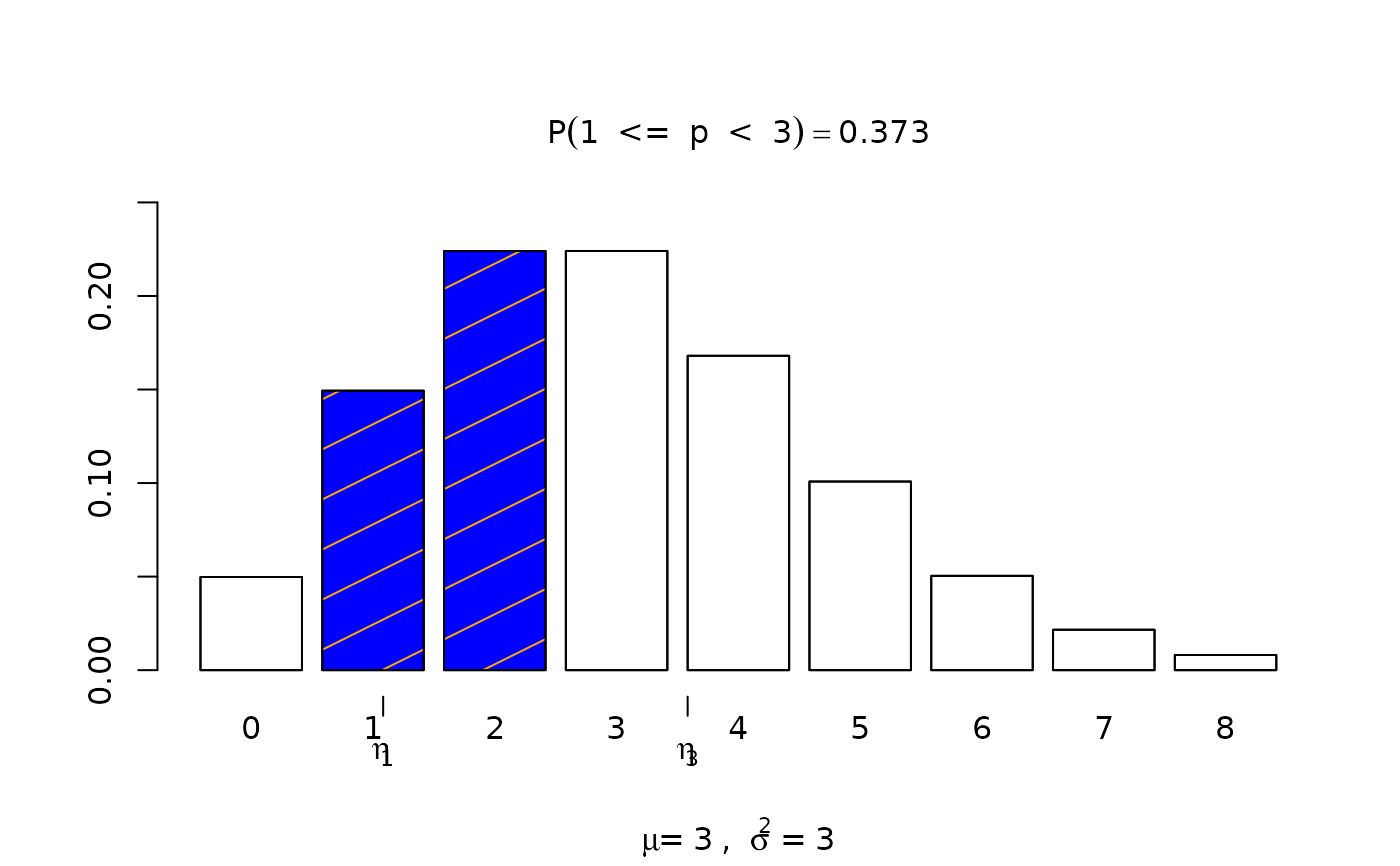
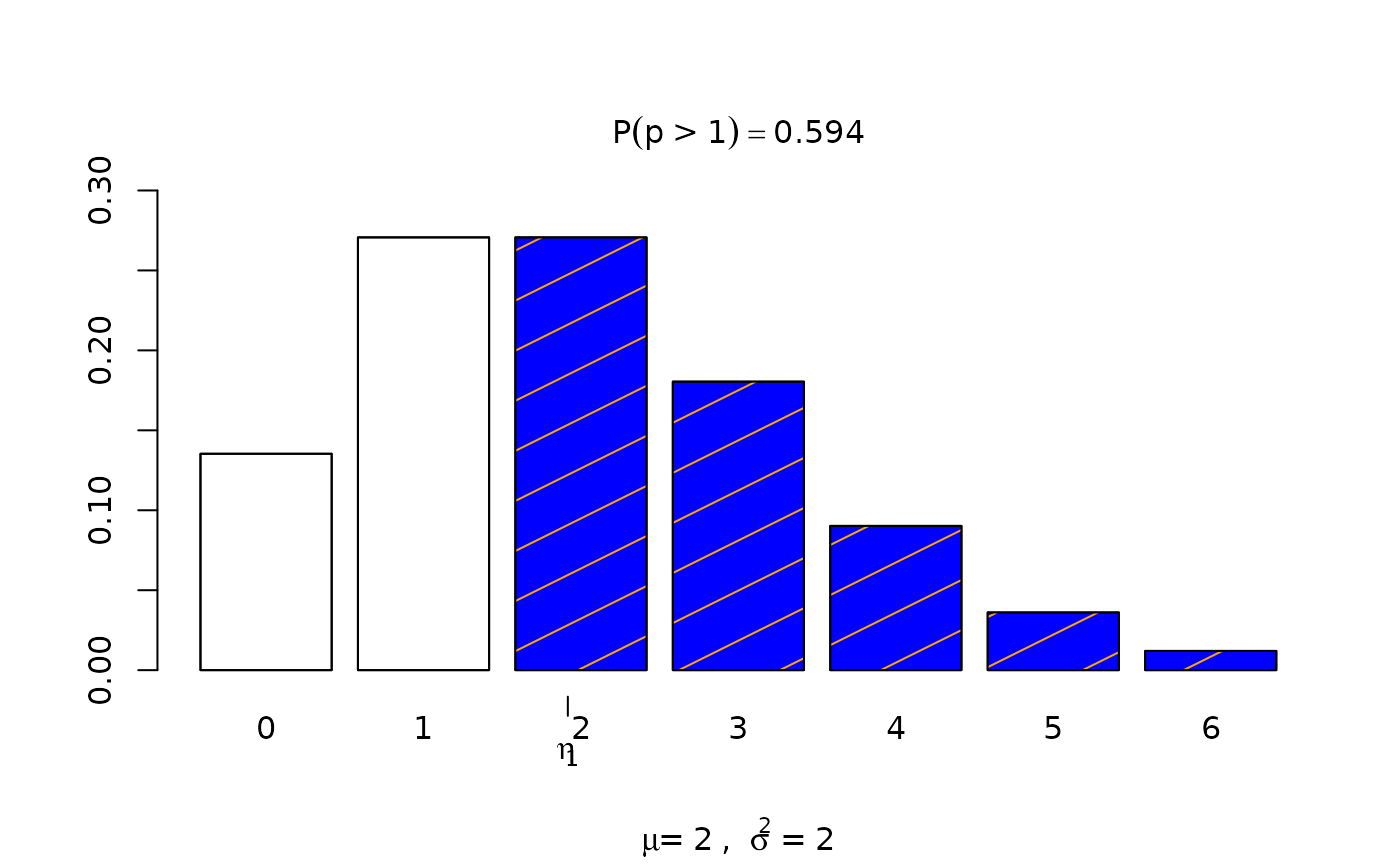
Generates a plot of the Poisson distribution with user specified parameters.
Arguments
- stat
a statistic to obtain the probability from. When using the "bounded" condition, you must supply the parameter as
stat = c(lower_bound, upper_bound). Otherwise, a simplestat = desired_pointwill suffice.- lambda
lambda value of the Poisson Distribution.
- section
Select how you want the statistic(s) evaluated via
section=either"lower","bounded","upper", or"tails".- strict
Determines whether the probability will be generated as a strict (<, >) or equal to (<=, >=) inequality.
strict=requires either values = 0 or =FALSE for equal to OR values =1 or =TRUE for strict. For bounded condition use:strict=c(0,1)orstrict=c(FALSE,TRUE).