Generates a plot of the Normal distribution with user specified parameters.
Arguments
- stat
a statistic to obtain the probability from. When using the "bounded" condition, you must supply the parameter as
stat = c(lower_bound, upper_bound). Otherwise, a simplestat = desired_pointwill suffice.- mu
mean of the Normal Distribution.
- sd
standard deviation of the Normal Distribution.
- section
Select how you want the statistic(s) evaluated via
section=either"lower","bounded","upper", or"tails".
Examples
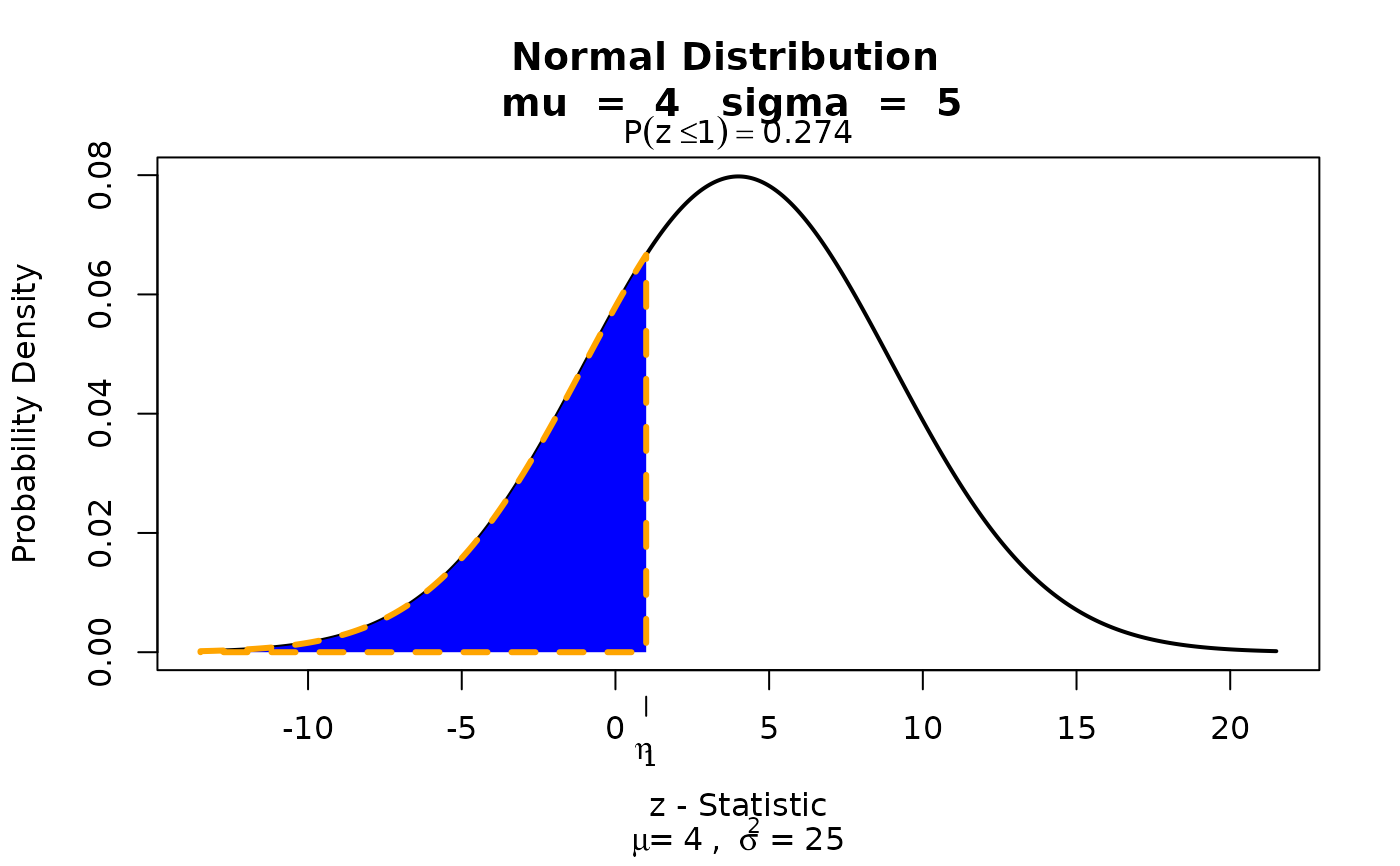
# Evaluates lower tail.
visualize.norm(stat = 1, mu = 4, sd = 5, section = "lower")
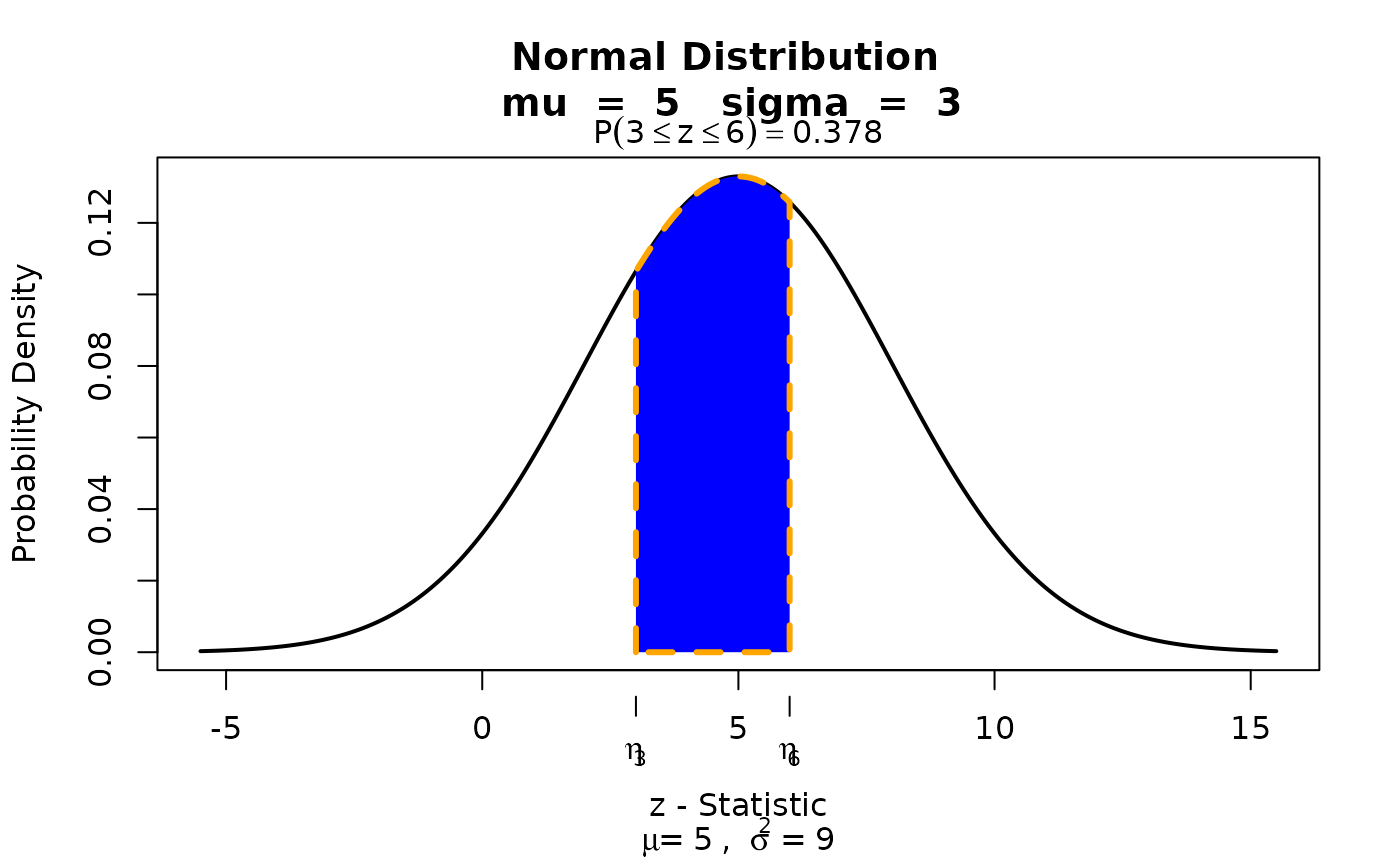
 # Evaluates bounded region.
visualize.norm(stat = c(3,6), mu = 5, sd = 3, section = "bounded")
# Evaluates bounded region.
visualize.norm(stat = c(3,6), mu = 5, sd = 3, section = "bounded")
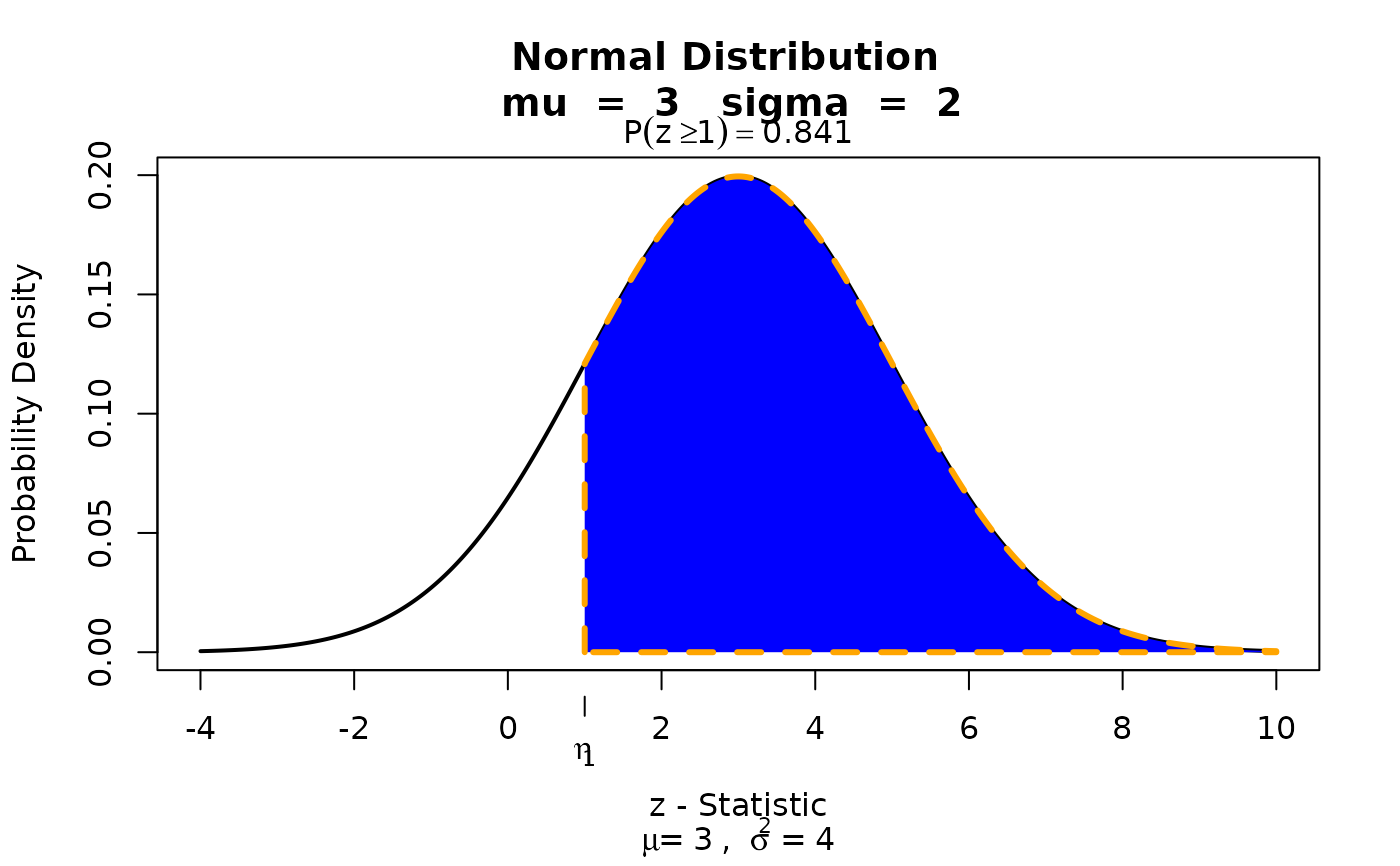
 # Evaluates upper tail.
visualize.norm(stat = 1, mu = 3, sd = 2, section = "upper")
# Evaluates upper tail.
visualize.norm(stat = 1, mu = 3, sd = 2, section = "upper")