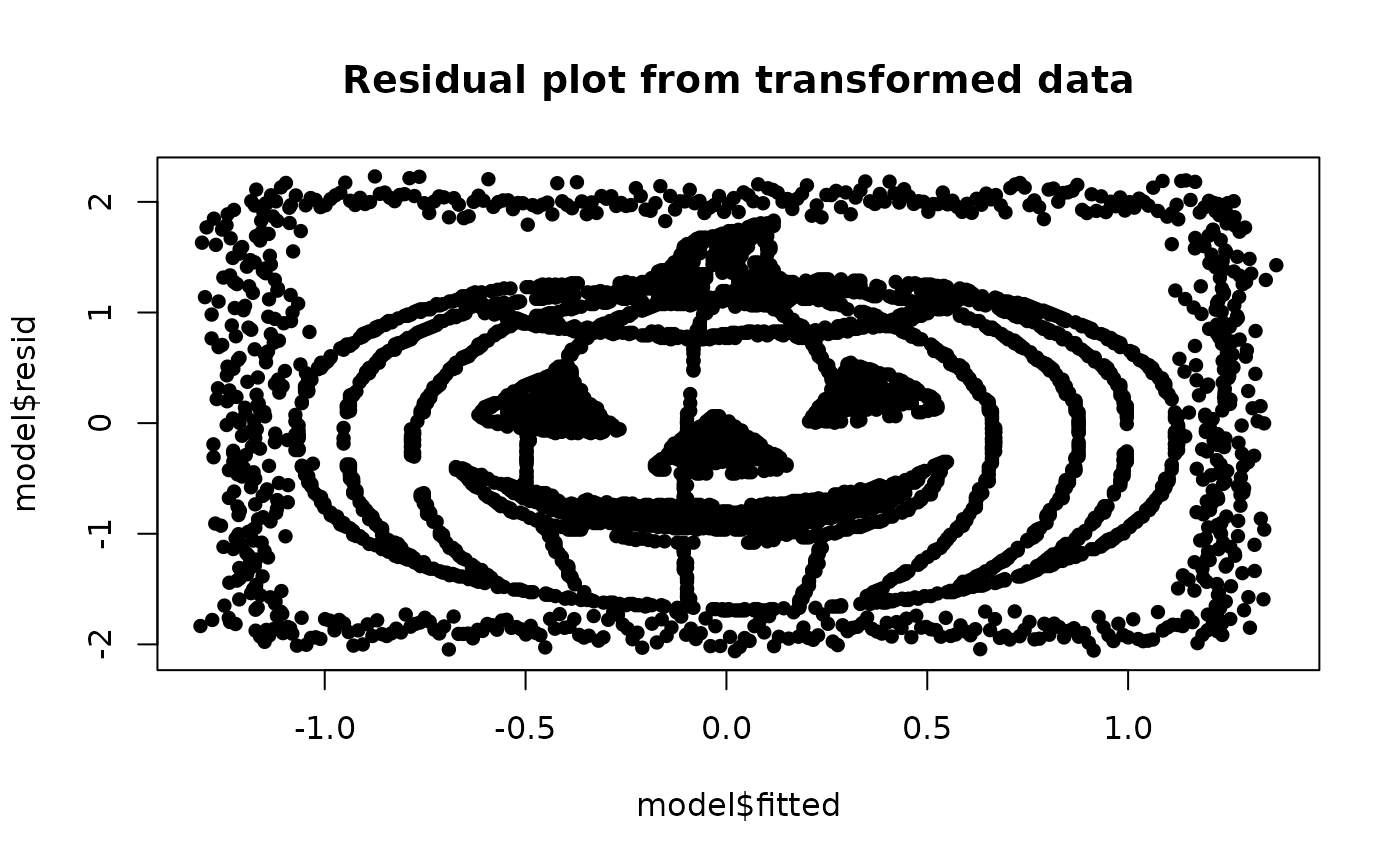
Data set containing a hidden image of a Jack-o'-Lantern lurking in the residual plot of a full model being fit.
Format
A data frame with 5,395 observations and 7 variables.
y: Response variablex1: Predictor variable 1x2: Predictor variable 2x3: Predictor variable 3x4: Predictor variable 4x5: Predictor variable 5x6: Predictor variable 6
References
Stefansk, L.A. (2013). Hidden Images in the Helen Barton Lecture Series. Retrieved from https://www4.stat.ncsu.edu/~stefansk/NSF_Supported/Hidden_Images/UNCG_Helen_Barton_Lecture_Nov_2013/pumpkin_1_data_yx1x6.txt
Examples
# Load the Jack-o'-Lantern data
data <- jackolantern_surreal_data

# Fit a linear model to the surreal Jack-o'-Lantern data
model <- lm(y ~ ., data = data)

# Plot the residuals to reveal the hidden image
plot(model$fitted, model$resid, type = "n", main = "Residual plot from transformed data")
points(model$fitted, model$resid, pch = 16)
